How’d We End Up With RGB?
Hi all, I’ve been hard at work on my thesis and ended up writing a section that definitely seemed like a blog post. My interest (in case you haven’t guessed from my prior posts) is how we handle subjectivity in computer vision. In this section, I look at what is possibly the most central subjective factor computer vision handles already: color perception. How did we end up with the red, green and blue color encodings that we use for digital cameras, screens and images?
It turns out the answer involves an argument started by Newton and Goethe, 17 British “trichromats” and the ostracization of German scientists after World War I. And, as I argue in this part of my thesis, our colorimetry system is actually one of the earliest machine learning solutions to an aesthetic phenomenon problem. The RGB system, rather than a scientific theory, is actually a designed model architecture, authored from the perspective of a small number of Anglo-American scientists and fit to data.
The Prehistory of Colorimetry
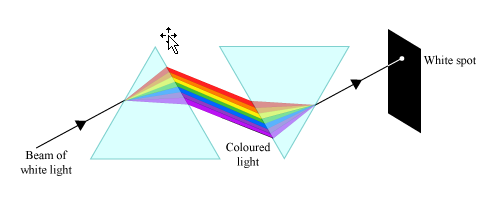
Newton’s prism experiment
As I’ve talked about in previous posts, western scientific study of color starts with Isaac Newton’s 18th century book on light, Opticks. He performed an experiment where he used a prism to split white light into a spectrum of colors, then used another prism to recombine those colors to form white light again. Based on that experiment, Newton argued that color was additive, and red, green and blue were the primary colors.
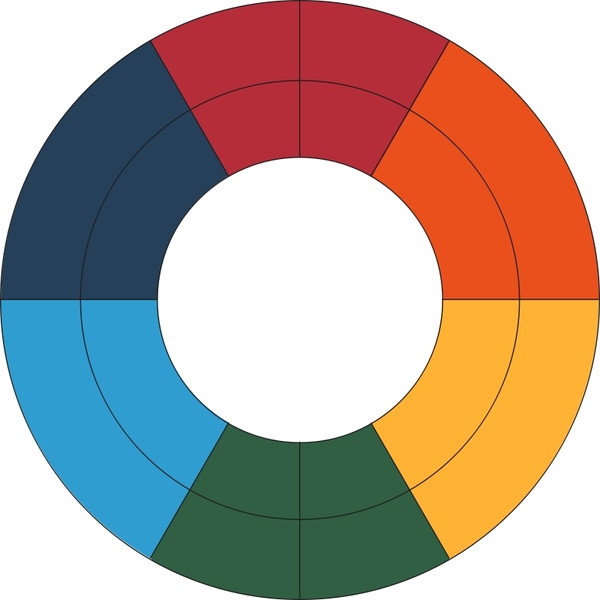
Goethe’s color wheel
A few decades later, the well-known German poet Johann Wolfgang von Goethe instead argued that color was not the result of splitting light, but an interaction between light and shadow on different physical materials. His book Zur Farbenlehre put forward a description of color phenomena focusing on the peculiarities of human color perception, which deliberately didn’t have any kind of scientific explanations.
In the 1850s, Young (of double slit experiment fame) and Maxwell (of electromagnetism fame) approached color and both confirmed that while there were many different colors of light, there were only three degrees of freedom in human color perception, and they corresponded to the primary colors red, green and blue. Then, Hermann von Helmholtz showed that pigments followed the principles of subtractive color, while light followed additive color, because pigments absorb light, so the blue, yellow and red primaries were also true — in fact any combination of three colors which were sufficiently different in hue could be used as primaries. The next decade, Gustav Fechner formalized the Fechner-Weber laws, which said that the perceieved strength of a stimulus was proportional to the logarithm of its physical source, and put forward his theory of aesthetics centered around the golden ratio.
At this point, it seemed obvious that color would soon be solved by science, much like other topics like electromagnetism, thermodynamics and chemistry were slowly being worked out. However, despite several early wins, the rest of human psychology, including color perception, was not easily reduced to simple physical laws. One mid-19th century dissident was Ewald Herring who put forward a system based on four primary colors organized along two axes: red/green and blue/yellow, where our sensitivity to red/blue was subject to the aftereffects of perceiving green/yellow and vice versa. Erwin Schrödinger (of cat fame!) showed in a 1925 paper that this model of color perception was actually equivalent to Helmholtz’s model.
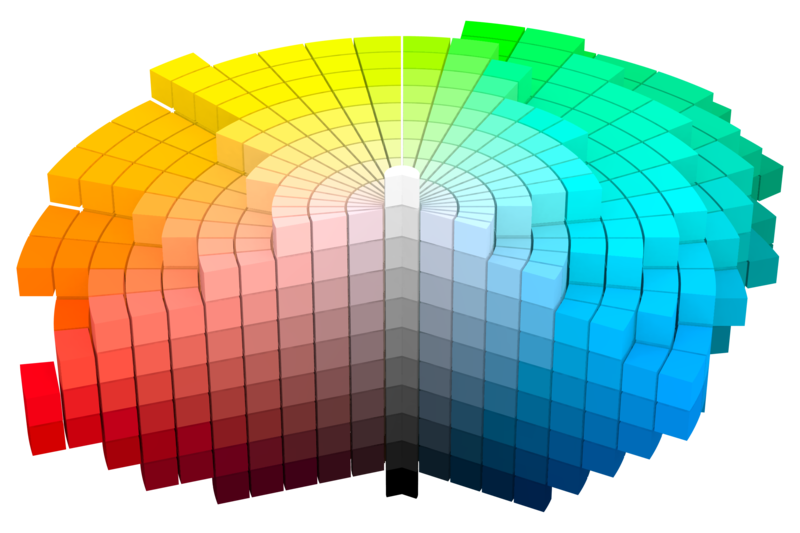
Munsell’s color system
By the turn of the 20th century, the rise of industrial-scale manufacturing and advertising led to a lot of practical problems regarding color consistency. Companies like Coca-Cola were really invested in maintaining branding consistency across lots of different media — labels, magazine pages, plastic signs, painted walls and film reels. Similarly, companies making electric lightbulbs needed a way to make sure that the bulbs built in one factory produced the same color of light as bulbs built in other factories! Different companies and print shops (some of which are still around, like Pantone or Kodak) developed their own color organization systems to keep things consistent. A fascinating story which I won’t go into is that of Albert Munsell, who approached this problem from an artist’s perspective and produced the enduring Munsell color system, which arranged discrete colors in a perceptually uniform hue-saturation-value space. Despite these color systems, large companies wanted a standardized, scientific solution.
The International Commission on Illumimation (CIE)
Against that backdrop, we get the origins of colorimetry in first meetings of the International Commission on Illumination (CIE, based on the French “commission internationale de l’éclairage”) starting in 1913. The organizers saw it as the extension of the existing committee on photometry, which had successfully adopted a standard unit for luminous intensity. They believed a similar set of units could be developed for color as well.
But there were strict national divides: the British and American scientists, following in the legacy of Maxwell and Newton, believed that a physics-based approach, only using three channels, with a “standard observer” model to substitute for human judgment, was best. However, the French and German scientists, following in the legacy of Goethe and Hering, took a more psychological approach. They wanted to model the human aspect, and take contextual factors like time dependence (think the color of glitter or flashing lights) and light/dark adaptation in human vision into account. So the CIE was at a stalemate.
Fortunately, World War I broke out, and all the German scientsts were kicked out of the CIE. They were not allowed to rejoin until 1928, due to a policy of ostracization towards Germany after the war. So the British and American camps got their way and commissioned a British scientist, John Guild, to measure human vision and find exact values for a standard observer model.
In 1930, Guild built his colorimetry apparatus and started testing humans. The idea behind this process is to use one lamp to generate each wavelength of light throughout the visible spectrum, then replicate that sensation through a combination of three primary colors. So, for example, they try to replicate our perception of actual orange light using a mixture of red, blue and green light. After repeating this process for each color in the rainbow, they arrived at three curves: the intensity of red, green and blue light, respectively, for each person. These are called “tristimulus values.” Guild tested the apparatus on seven people, identified by name in his paper. Six (male) scientists and a (female) secretary.
Fortunately, another British scientist, a graduate student at Imperial College named William Wright, did a similar experiment the previous year. He build a different apparatus, in a different location, using a different procedure on ten participants (only identified as “trichromats” meaning they had “normal” color vision). That worried Guild: he delayed sharing his data with the CIE because he was worried the two studies would disagree and they would have to collect more data. But fortunately, the tristimulus values agreed almost perfectly!
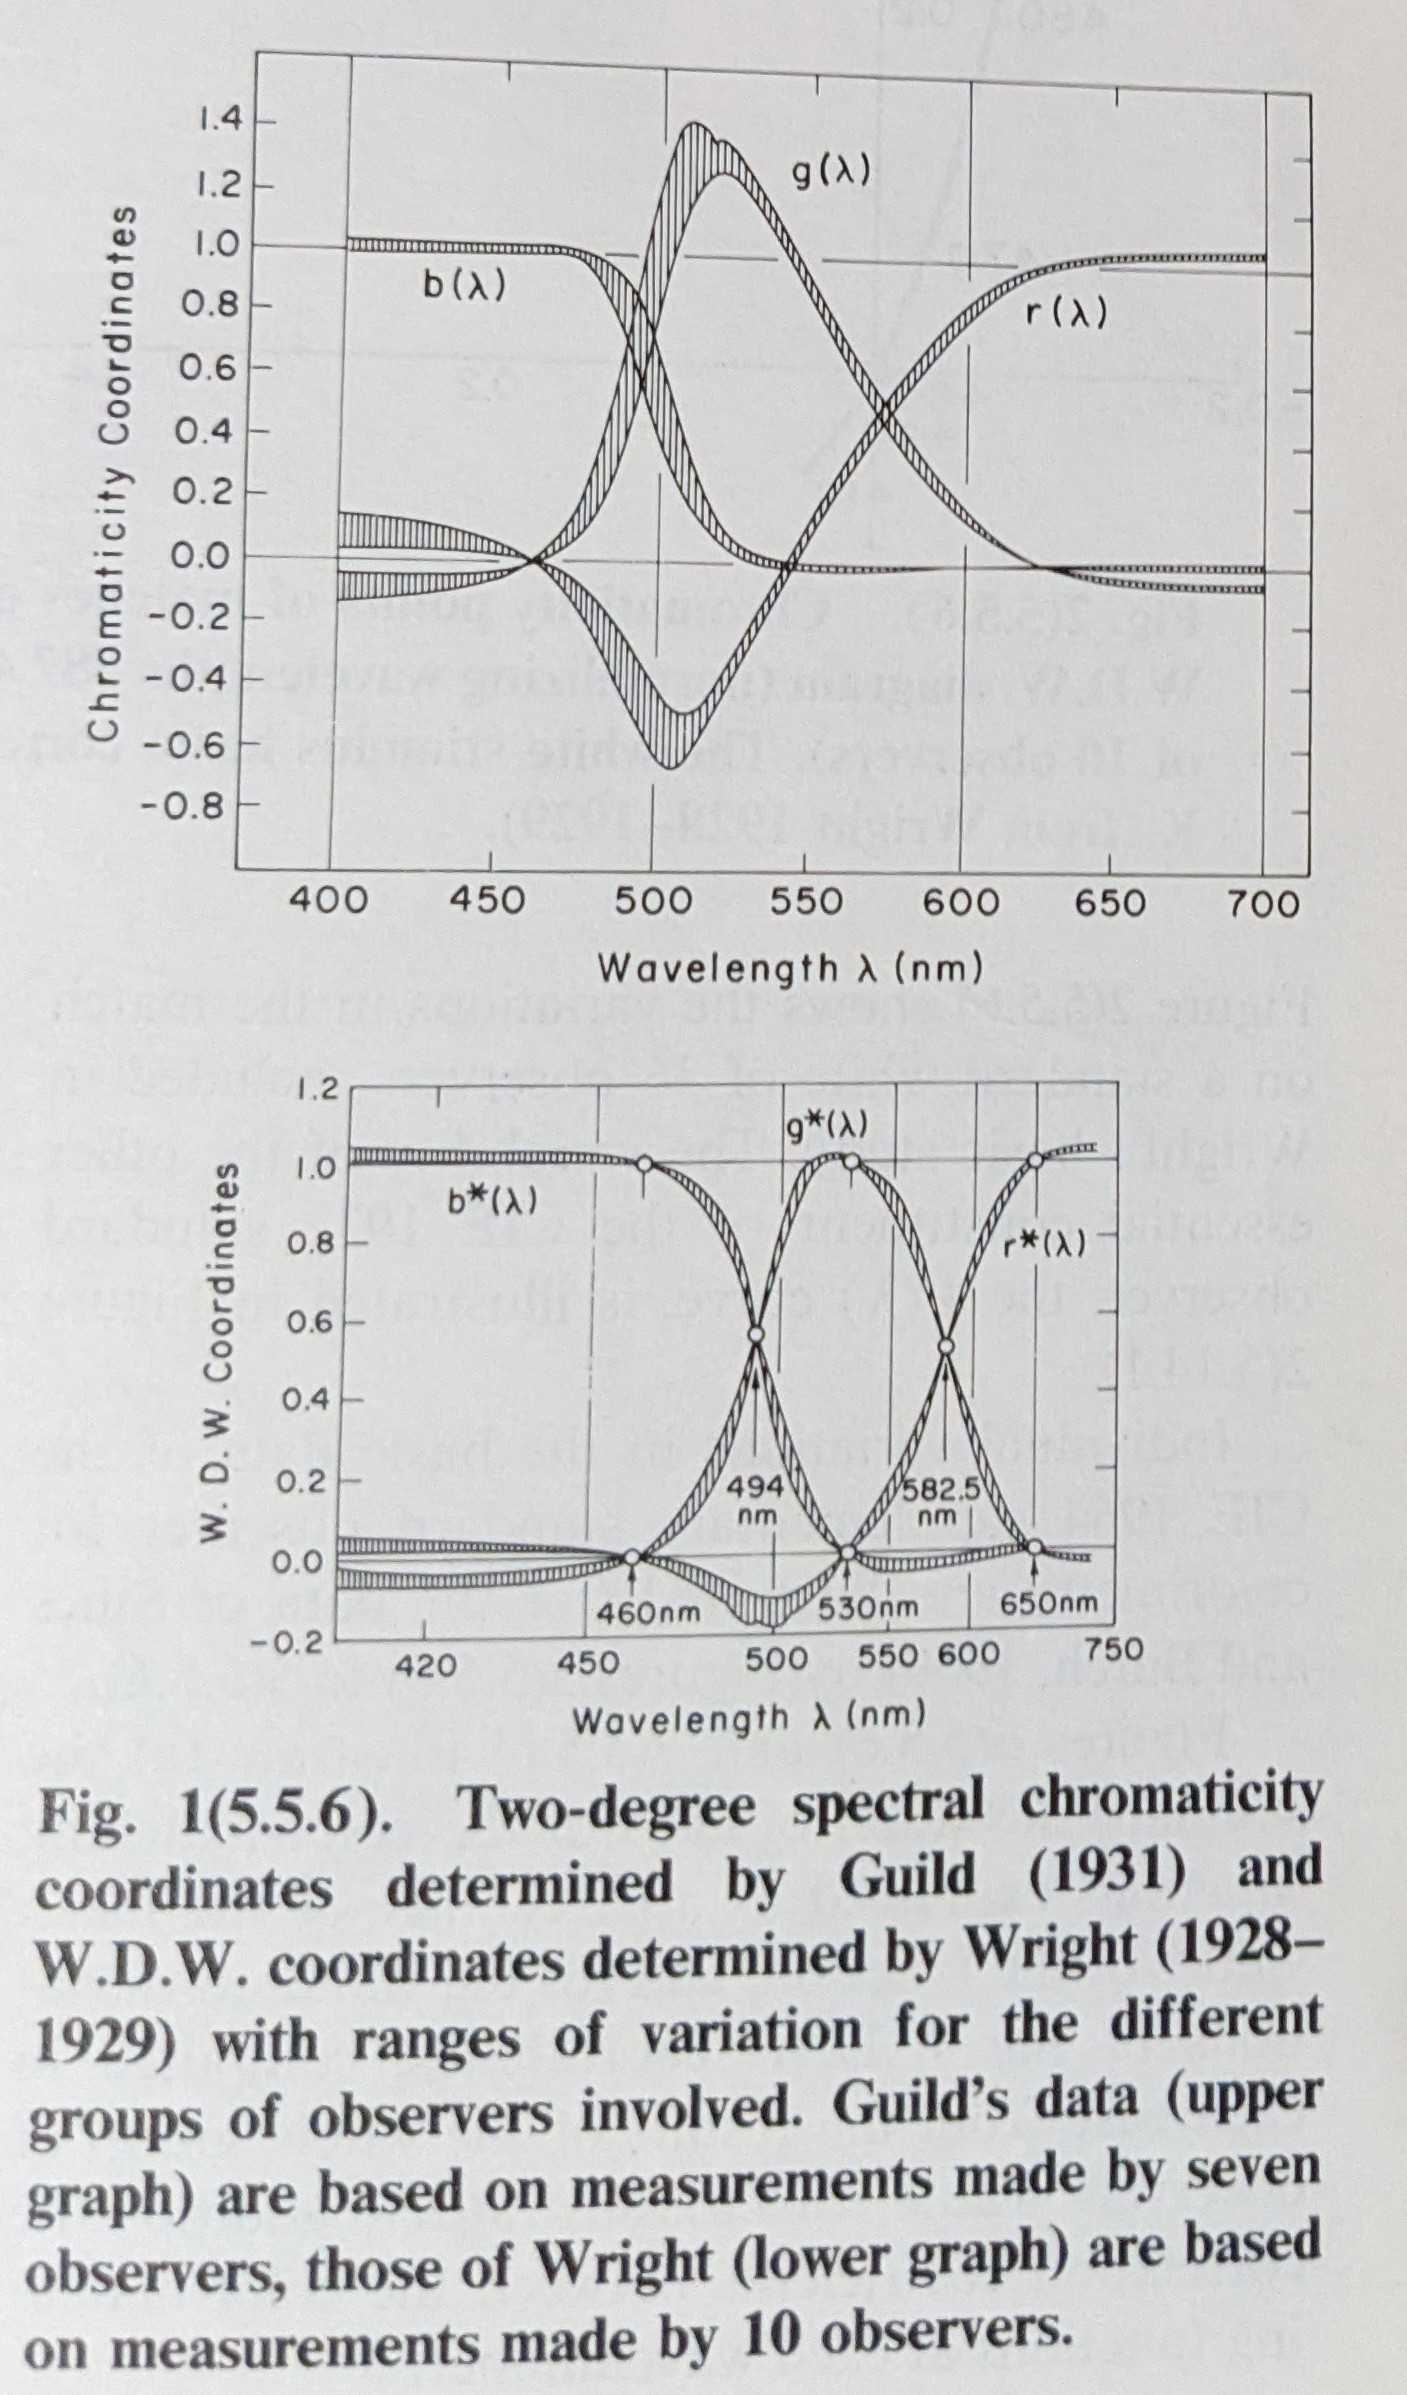
Guild and Wright’s 1931 tristimulus curves, with error bars shown.
The British scientists at the 1931 session were determined to agree on a standard observer, but the American delegate, Irwin Priest, wasn’t convinced. Wright wrote at the time that he believed Priest had been told by the US government to delay adoption. But, according to Wright, each day Priest would raise a concern, and each night Wright and Guild would redo their data analysis to resolve the concern, and eventually Priest gave up, and the CIE adopted the 1931 tristimulus values, averaged between Wright and Guild’s data.
From Tristimulus to sRGB
The CIE 1931 Standard Observer model
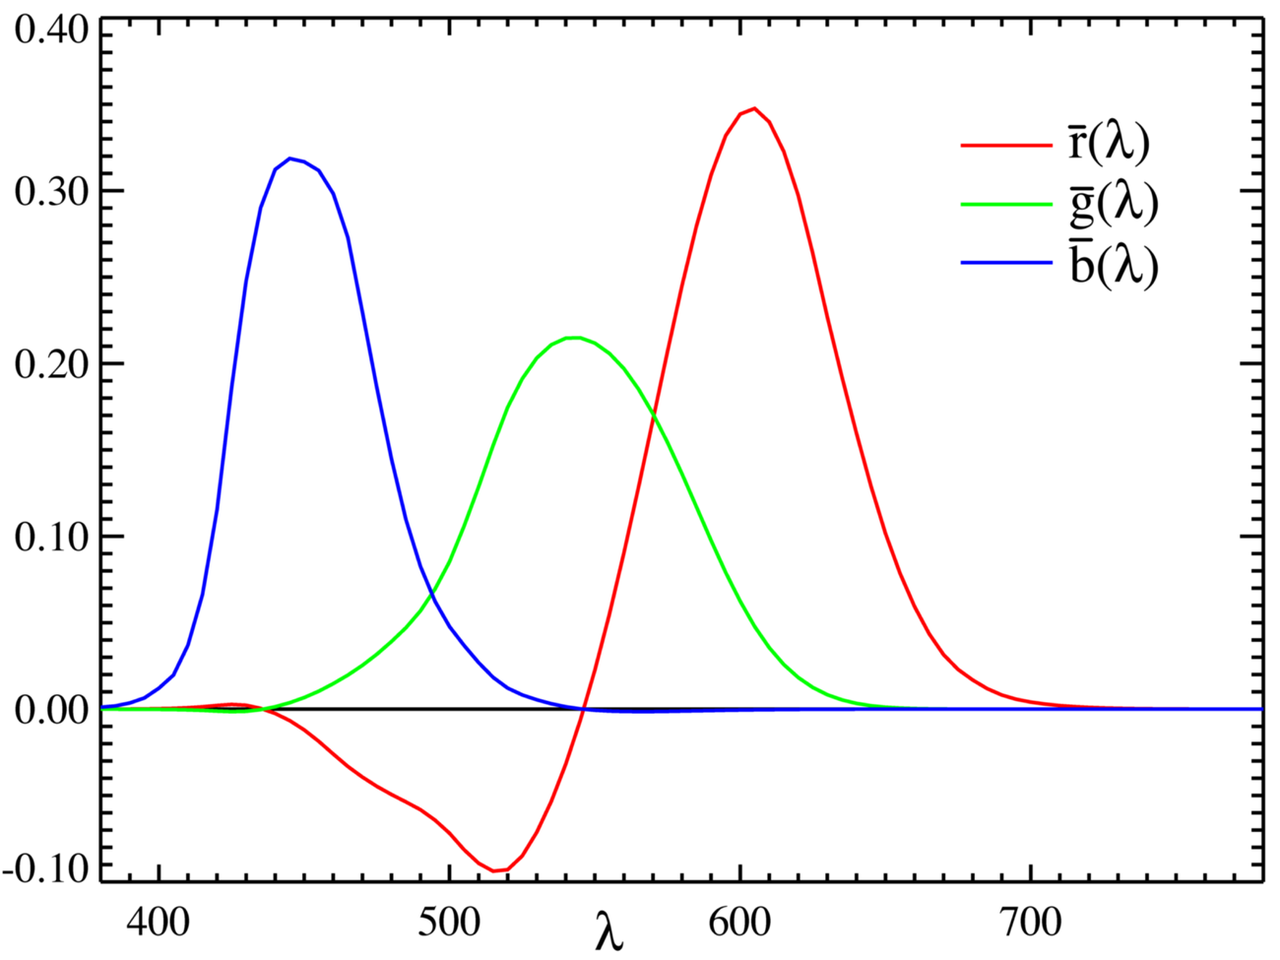
Those original standard observer tristimulus functions are typically called \(\bar r(\lambda) \bar g(\lambda) \bar b(\lambda)\), since the r,g and b coordinates are based on the average of those 17 human tristimulus curves. We assign a three dimensional value to each color of the rainbow based on its integrated response to each of those functions. Then, we can reinterpret those values as coordinates in a three-dimensional space, which is typically called the CIE RGB color space. The CIE XYZ color space is defined through a linear transformation of CIE RGB color space. Literally, we just do a matrix multiplication to change the axes of the color space so that the Z axis is aligned to the axis of gray colors with equal red, green and blue values. The particular matrix is approximately:
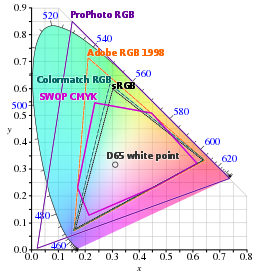
\[\begin{bmatrix} 2.365 & -0.897 & -0.468 \\ -0.515 & 1.426 & 0.089 \\ 0.005 & -0.014 & 1.009 \end{bmatrix}\]From there, we can define other color spaces by choosing sets of points (usually \(2^8 = 256\), \(2^{16} = 65\) thousand \(2^{24} = 16\) million) in XYZ space. Those shapes are called gamuts, and they are typically shown using a 2D cross-section along the X-Y plane called a chromaticity diagram. Each camera, screen, printer or projector that we use has its own gamut with its own chromaticity diagram, which engineers have carefully calibrated to work with values from standard RGB, or sRGB color space.
Several gamuts for different color spaces, shown on the X-Y plane of CIE XYZ color space.
So that’s it! To answer our initial question, we got to RGB because Newton and Maxwell identified them as primary colors for light, and we define RGB, to this day, in terms of measurements taken by Wright and Guild on seventeen British adults.
Is That Right?
That sounds a little too cute for science. Usually, when scientists arrive at a rough estimate of something, they refine that estimate over the following decades as theory and measuring instruments get better. But that didn’t happen to colorimetry — a group of Anglo-American physicists just…decided what the standard observer would be, in order to resolve a geopolitical conflict over industrial standards while the Germans, who had a much more psychological approach, weren’t allowed to participate. While the CIE did arrive at another standard based on a different size stimulus (the CIE 1964 tristimulus functions), most industrial standards are still defined in terms of the 1931 values.
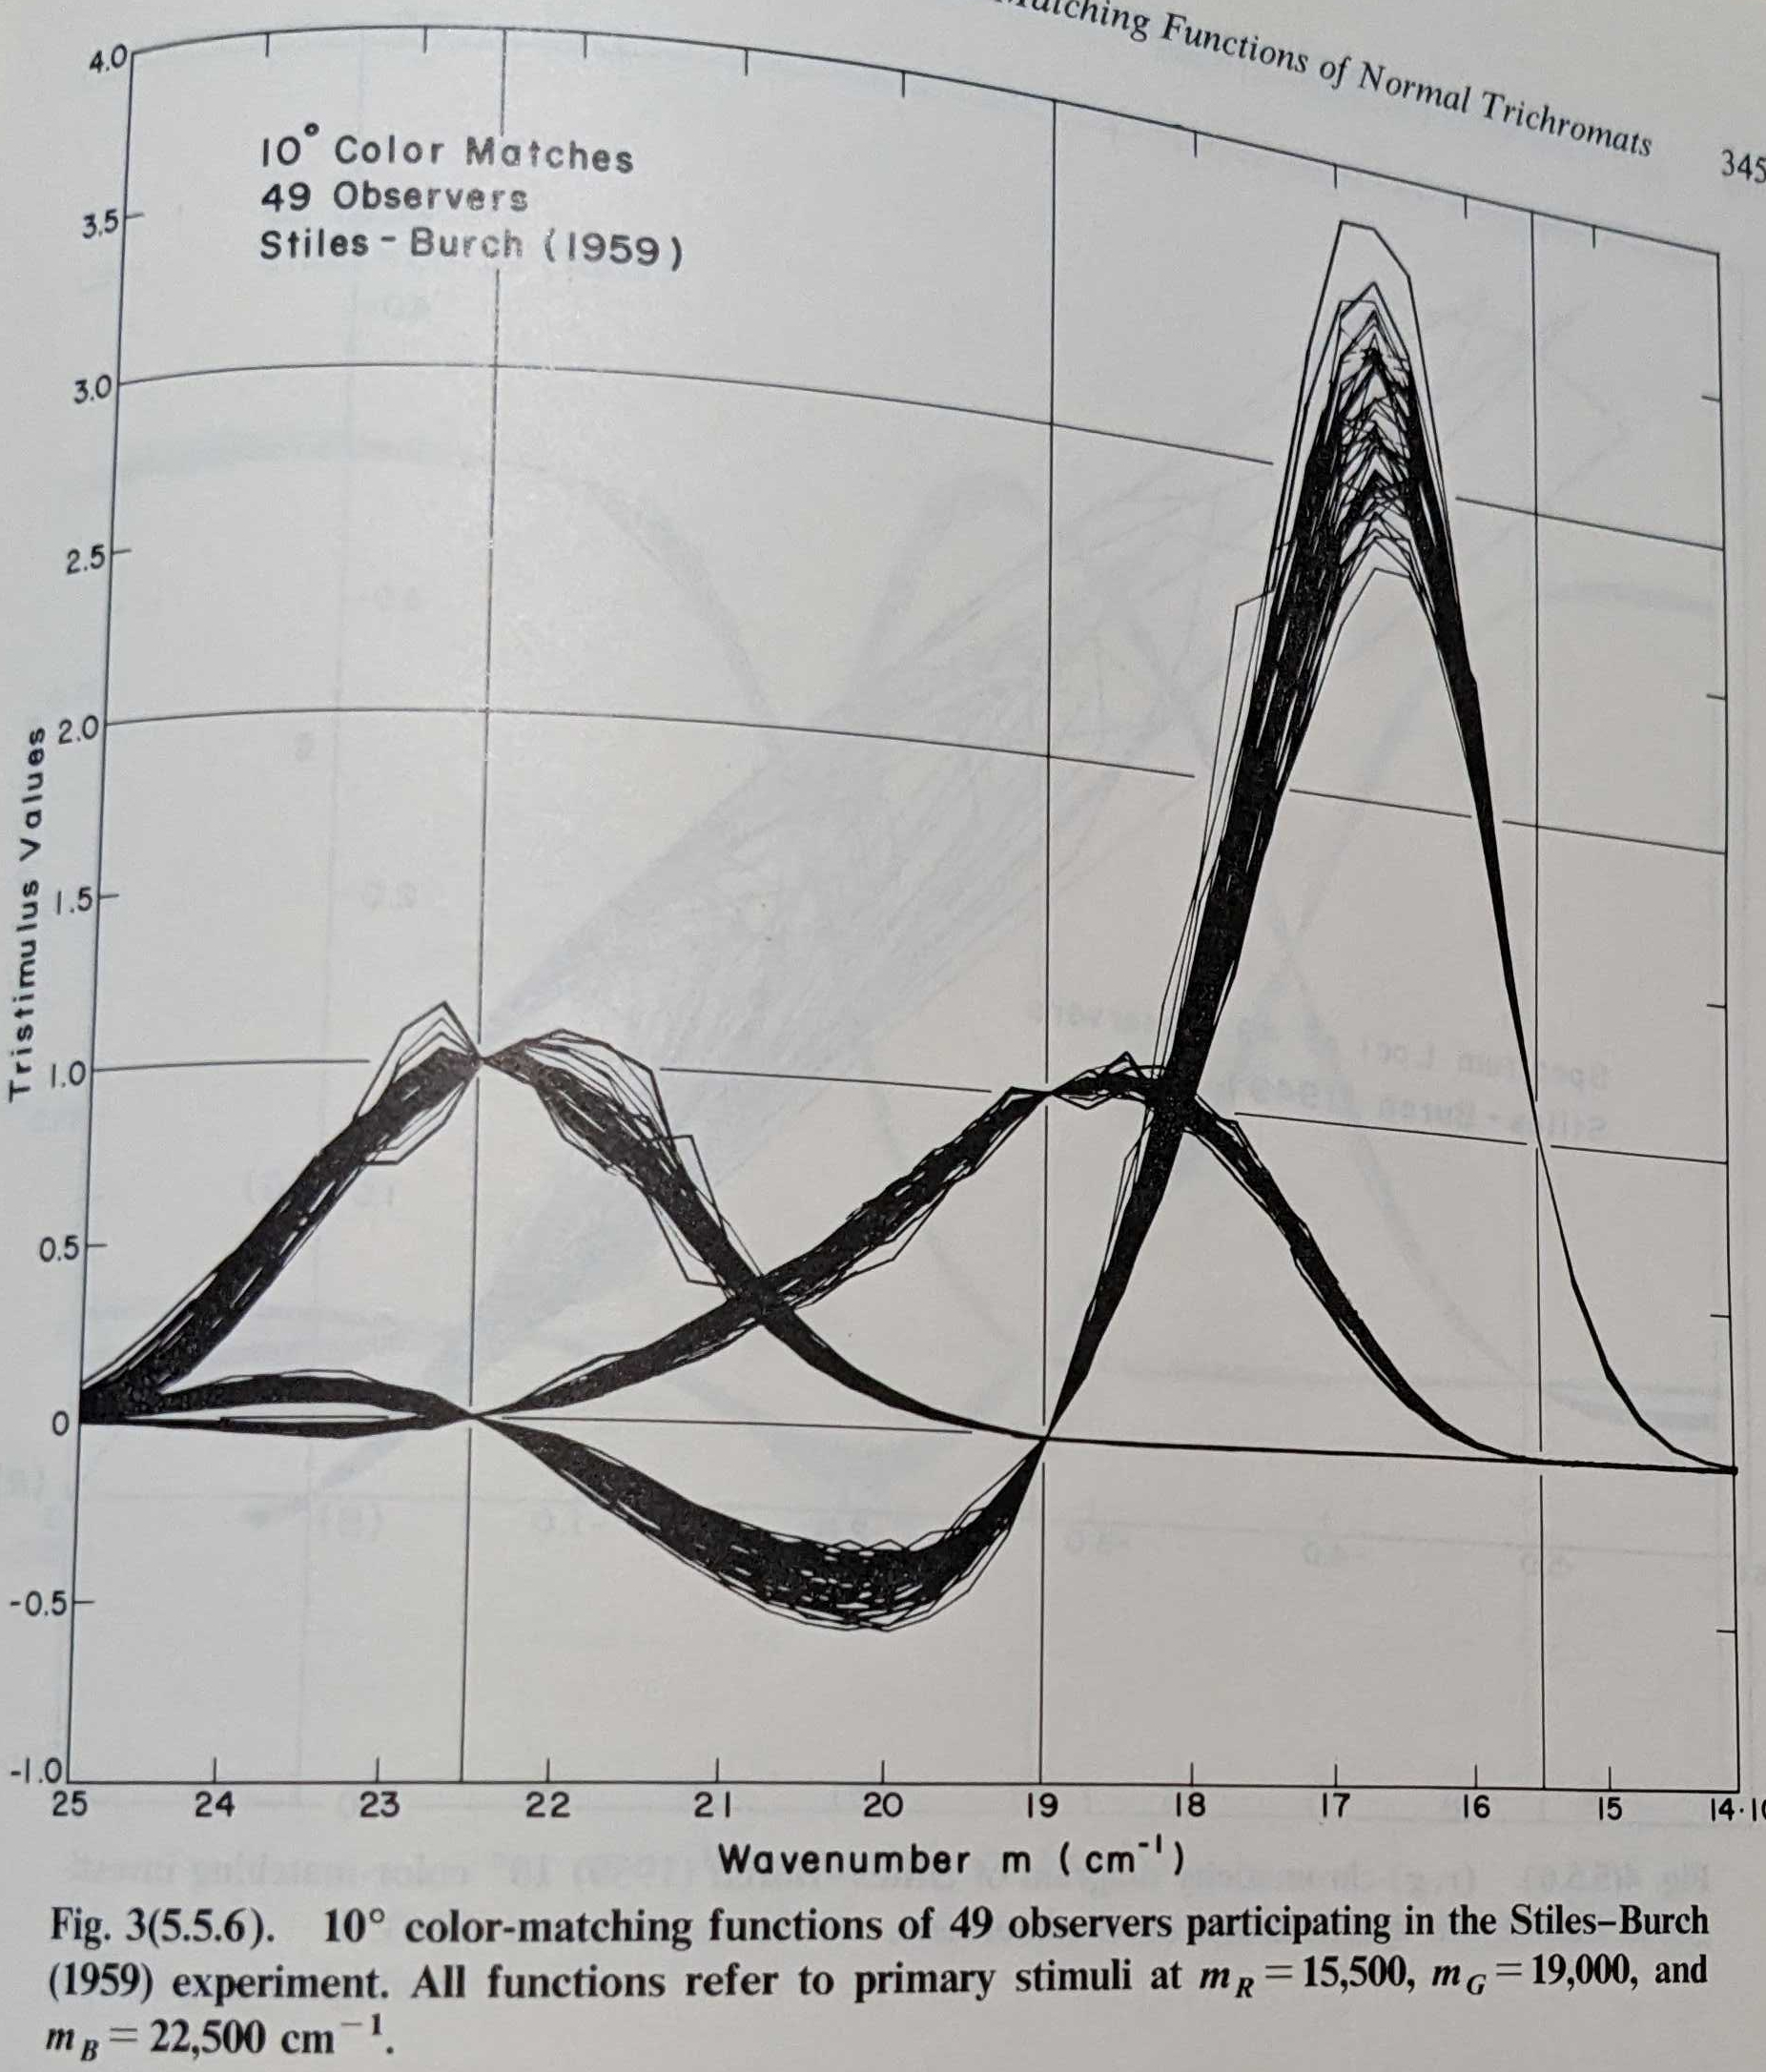
Stiles-Burch tristimulus curves for 49 observers.
Wright and Guild arrived at similar results, in part, because of historical factors: they were both determined to arrive at a single definition of “normal” color perception, despite individual variation. This approach responds to Munsell’s groundbreaking color system a decade earlier, and exists in service of industrial applications. In reality, there is no “normal” color perception. Human color perception varies based on age, sex, and a variety of color vision defficiencies (“color blindness”), as well as based on cultural factors and very slightly from individual to individual based on the arrangement of cones in the eye. They did not take a random sample of the population, and likely heavily selected the participants they chose to study based on their “ideal” vision.
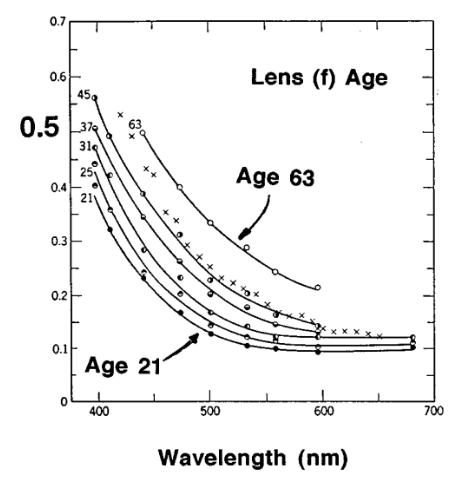
Optical density within the eye of different wavelengths varies with age. Young eyes absorb less light before it reaches the retina than old eyes, and young people see more wavelengths than old people.
These authors are also very upfront about their motivations. Guild argues, “The international photometric scale which governs the output of large industries concerned with the production of illuminants, necessitates the elevation of some particular set of visibility data to the dignity of a standard, to be used universally in all computations carried out for technical purposes. Hopeless confusion would arise if every lamp manufacturer, or every photometric standardising laboratory, employed units based on individual judgment as to the most accurate visibility data available at any particular time.”
Similarly, Wright speculates, “It has become abundantly clear that, until data for a ‘normal’ eye have become standardised, the scope of colorimetric science will be strictly limited…I should not, therefore, be surprised if subsequent research shows some modifying influences to exist; but if such is the case it is safe to predict that any eccentricities will be of a small order and unlikely to affect the value of practical colorimetry.” In other words, they do not arrive at a standard observer model because it is accurate to human vision, but because it is useful for scientific and industrial applications, and accurate enough for the short term.
For these reasons, I think the standard observer color model is actually more similar to contemporary machine learning than it is to natural science. The physicists, much like many modern machine learning engineers, are faced with a technical problem involving human perception and assume that there must be a simple solution. They then design a model to fit their assumptions, and fit the model to data and make that model a standard for others to build on, without ever really testing their assumptions.
But it works!
![]()
The CIE 1931 color system has been a extraordinarily useful model. Everything we do with color on computers is built on it at some level. Even though it’s not a particularly accurate model of the way humans see, the standard observer works well enough that devices and algorithms built on it seem to work as well. It has been justified as a model, not because of its scientific truth, but because of its utility as a design.
However, it’s important to keep in mind that every digital image, no matter how objectively it was taken, always has this little bit of human subjectivity built into it. That means all computer vision systems based on RGB cameras inheret this little supervised learning model, fit to data for 17 British participants with “normal” vision, and all of its assumptions about whose vision is normal and whose is abnormal.
If you’re interested in learning more check out these papers:
- Robert M. Boynton “History and current status of a physiologically based system of photometry and colorimetry” (1996)
- Sean F. Johnston “The construction of colorimetry by committee” (1996)
- John Guild “THE COLORIMETRIC PROPERTIES 0E THE SPECTRUM” (1931)
- William D. Wright “A re-determination of the trichromatic coefficients of the spectral colours” (1929)
- If you really want to know everything there is to know about color science, check out the textbook by Wyszecki and Stiles. I couldn’t find it online, so I got it from the library. YMMV