Expert Models
12/20/16
The next step towards machine composition of four-part harmony, after working with a naive generative model, was to try to implement other models that better preprocessed training data. My ultimate goal with these is to apply Geoffry Hinton’s Product of Experts and multiply together the output probability distributions of several models trained on different aspects of the training data to get a more nuanced result.
The implementations of these models, along with all of my code for this project, can be found on github.
(It is important to say before I go on that by different models, I mean different approaches to preprocessing. Inventing new varieties of neural networks is way beyond the scope of this project.)
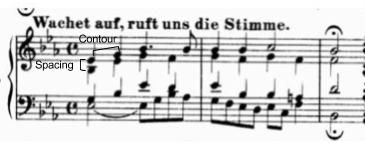
Voice Spacing
The first of these models that I built was a voice spacing expert. I came to the idea of predicting spacing after trying to figure out a way to model relative pitch without encoding any information about the key of the piece. Rather than train on a one-hot encoding of the absolute pitches of all of the voices, I train it to predict the interval (distance between notes, measured by the number of notes on a chromatic scale in between the two) between two voices given the prior intervals between those voices. As in the naive model discussed in my last post, I want to build a recurrent neural network using LSTM layers that learns to output an encoding of some output as a function of a time series of some input. Here, I want the output to be a one-hot encoding of the interval between two voices in the next timestep of a piece, and the input to be a one-hot encoding of the interval in the current timestep.
I’m treating interval distance as a nominal attribute rather than an ordinal one because similarly-sized intervals do not have similar affect (yes I do mean affect and not effect!). For instance, a major third (four notes apart) and perfect fifth (seven notes apart) sound much more similar than a perfect fifth (seven notes apart) and a diminished fifth (six notes apart). Rather than try to preprocess out all of the differences in sound between different musical intervals (though an interval quality expert may be a good extension of this model), I decided to leave that out and treat all intervals as equal and unordered attributes.
I had reasonably good results with this model. Some images of the training process:
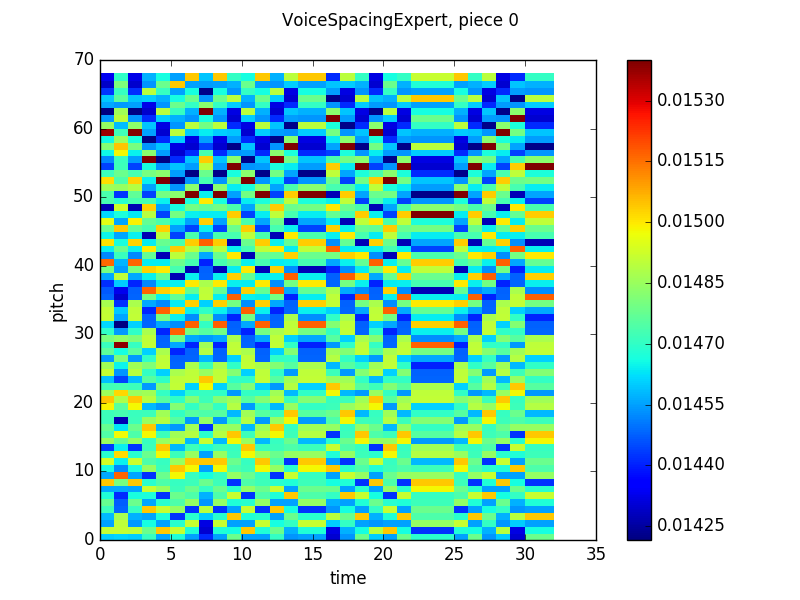
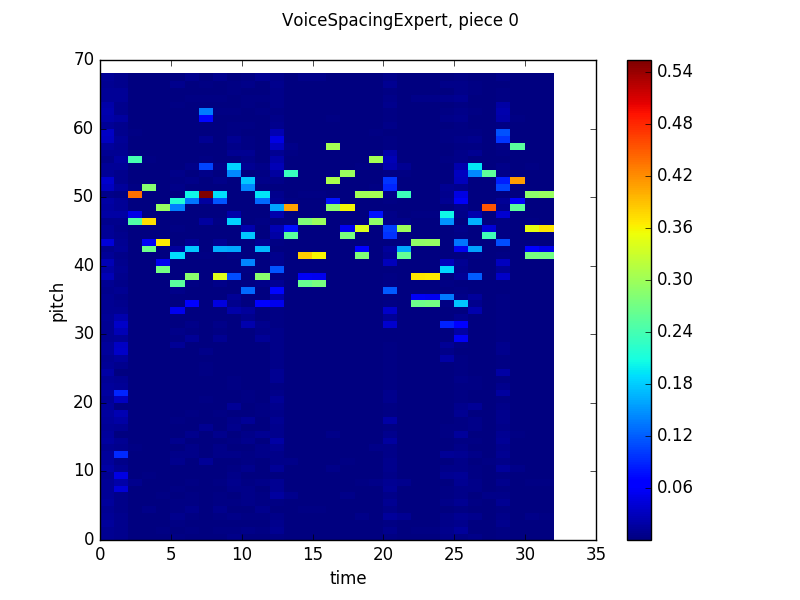
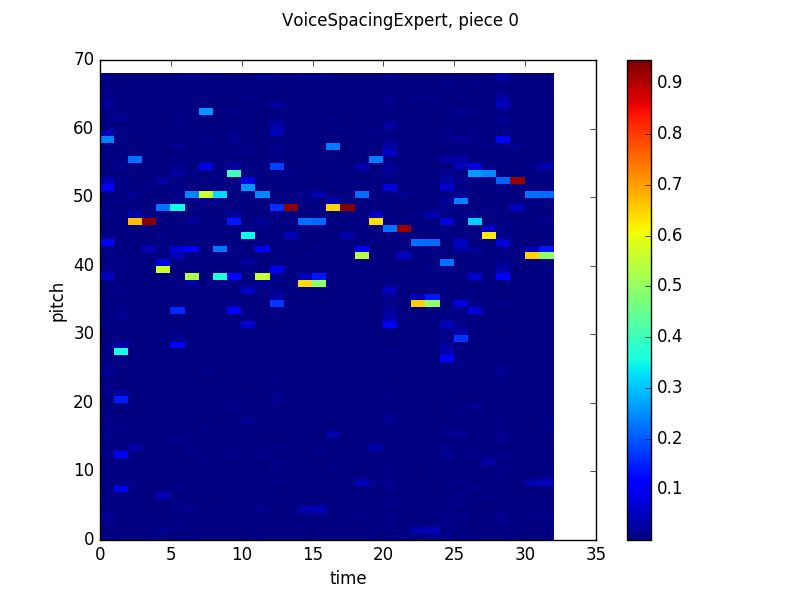
These graphs use the same visualization scheme as the graphs from my last post. The Y-axis is pitch, the X-axis is time and the heatmap color at timestep n and pitch m is the probability that the network will output that pitch given the previous n-1 timesteps of the actual piece. Since this graph shows results in terms of absolute pitches, the columns look “rolled” up or down based on the pitch of the voice the spacing is being measured in reference to. The network seems to learn that two possible next relative pitches, that are about five half steps apart, are most likely, but will stray from that prediction in certain circumstances (like in timesteps 3-11 of the output from batch 120).
Voice Contour
After getting reasonable prediction accuracy from the spacing model, I made another model based on contour. Like voice spacing, voice contour measures relative pitch, but instead of measuring the distance between two pitches played at the same time in different voices, it measures the distance between two pitches played sequentially in the same voice (music theorists refer to these as harmonic and melodic intervals, respectively).
Measuring pitch distances across time added a few implementation issues. First, while the dataset I had didn’t have much in the way of large jumps, some theoretical input data could have a jump of at most the lowest note to the highest note. That means that the input encoding needed to have a space for each possible interval. While it’s easy to double the size of the encoding, that means that the network can now output an interval equal to the total range of the piece at any timestep, even when the input note is not the minimum note in the piece. That’s not a problem for a contour model, but if I follow through with the product of experts, I’ll need to feed back an absolute pitch sampled from the product distribution as input to the spacing model for the next timestep. If that can exceed the highest or lowest note in the training data (the range of pitches that have inputs with weight matricies allocated for them), they might end up creating spacings too large for the spacing model (this sort of positive feedback problem arises in electronics (and other fields) a lot when something depends on its own first derivative). Rather than allocate new inputs for notes that end up too high or low, I decided to truncate the outputted probabilities if they exceed the upper and lower bounds.
Second, there’s no way to predict the first note of a melody using a contour model, since the first contour that exists in a piece is between the first and second note, and I’m interpreting the difference between two notes as a prediction of the second of those notes. Rather than interpret the first output as the contour between some “zero” note and the first note of the melody, I feed in a previous contour of zero for the first two timesteps and use the first note of the actual melody instead of what the network outputs. While that goes against the spirit of generating music from scratch, it is an easy solution to a complicated problem (if we continue the analogy that contour is like the first derivative of pitch, this is adding the “+C” when taking the antiderivative to get back to pitch).
Here’s the contour model output (note that since I was tossing the network’s output on the first timestep, I just set the output to be equal probabilities for each note, which skews the color scale in the first graph):
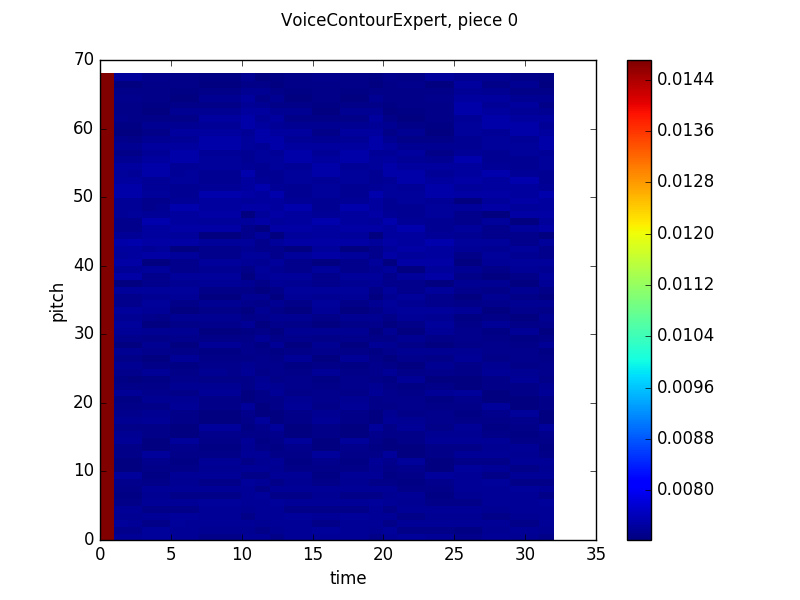
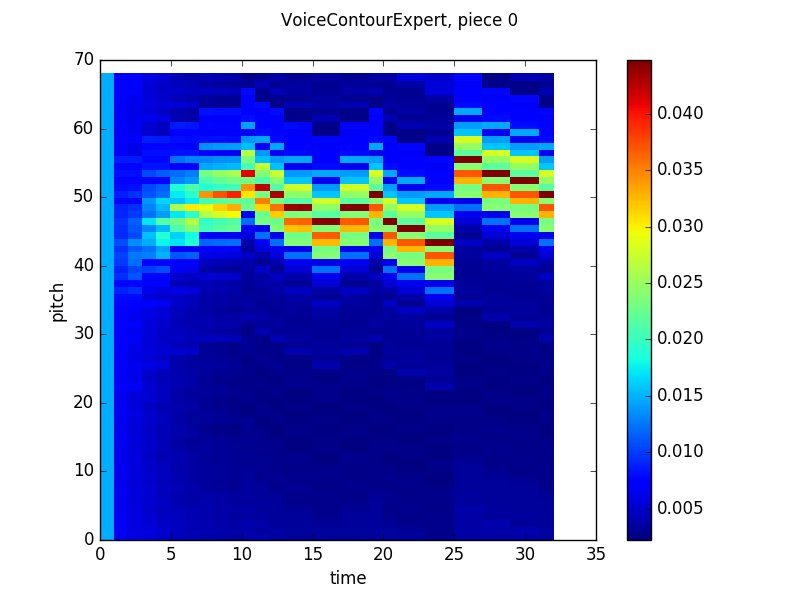
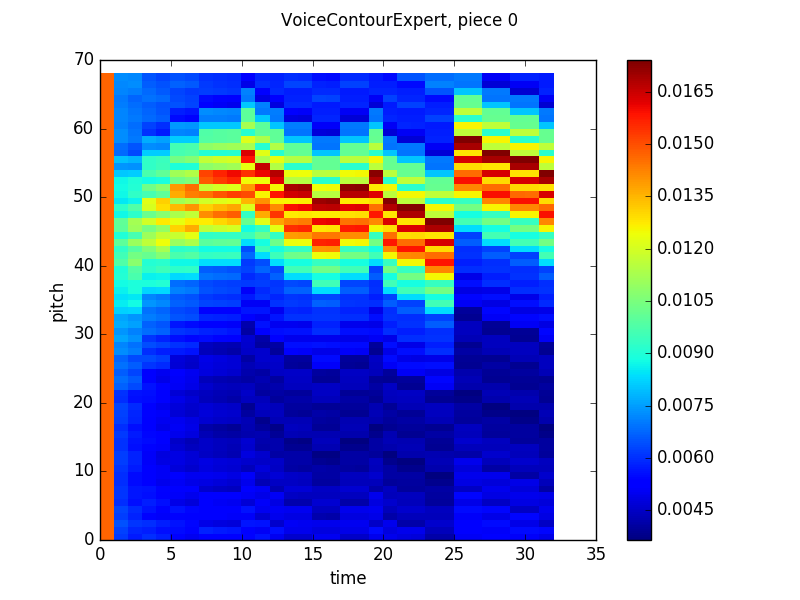
The contour model learned what, in hindsight, seems obvious – that at any given timestep, the melody is probably going to stay in the same place or move by step in another direction, which leads to an output that at first glance looks gaussian, but upon closer examination, assigns probabilities is a an alternating high-low pattern, preferencing major seconds over minor seconds and minor thirds, etc. Two other things to note: first, as training continued, the model actually became less confident in certain intervals and more confident in neighboring intervals. This was probably a result of overfitting early in the training process that was reversed as the model saw more counterexamples to the false pattern it had trained to reproduce. Second, the model seems to have higher uncertainty in the first few timesteps of the piece and then outputs basically the same distribution over each timestep for the rest of the piece. While it is likely that the model will not commit to any specific notes when it is unsure of the context of the piece, I’m not sure why it settles on a specific distribution. Maybe the LSTM gates are learning to not change much with time for some reason? Anyway, if anyone reading this post has any ideas, feel free to let me know at the email address in the sidebar!
Beat Position
Since all three of the models I worked with already dealt with pitch input, I was interested in trying another that dealt with rhythm. The model I came to was one that took the previous generated absolute pitch as well as beat information (say, whether we were on beat one of a measure or the offbeat between beats three and four) as input and produced a probability distribution over the next timestep’s pitch. The intuition was that some places in the meaure are more likely to be in the middle of longer notes (for instance, notes are more likely to begin on downbeats than upbeats, and on the first and third beat of the measure rather than the second or fourth), which would cause the network to output the same pitch as was inputted. Further, pitches that have previously occurred on certain beats in a piece may be more likely to occur on those same beats if a musical idea is repeated.
Here’s that output.
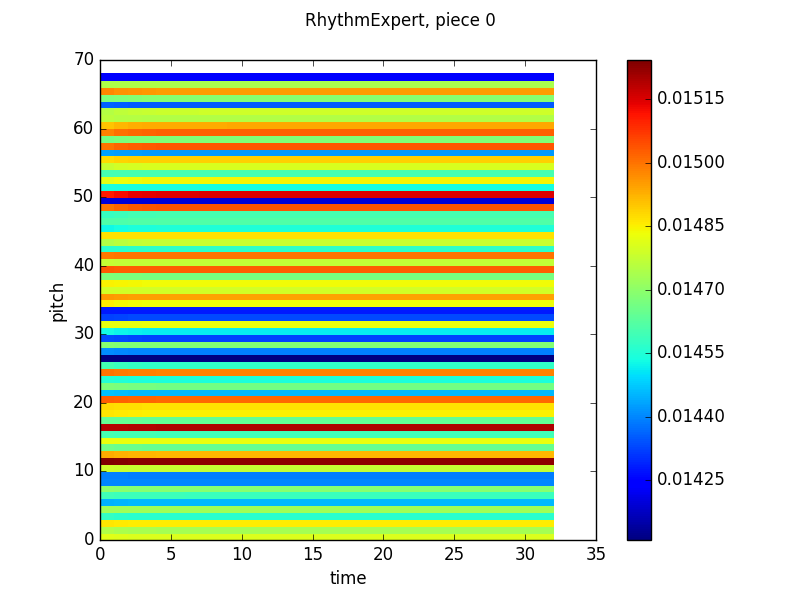
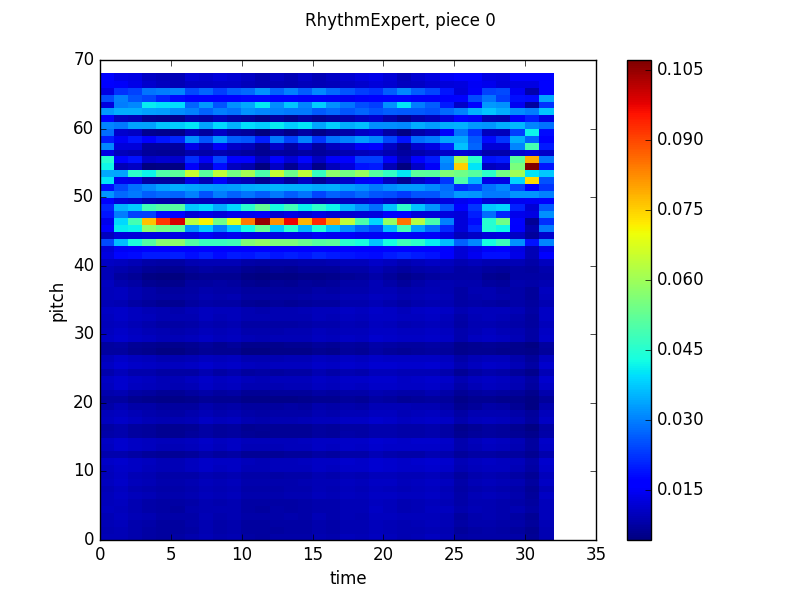
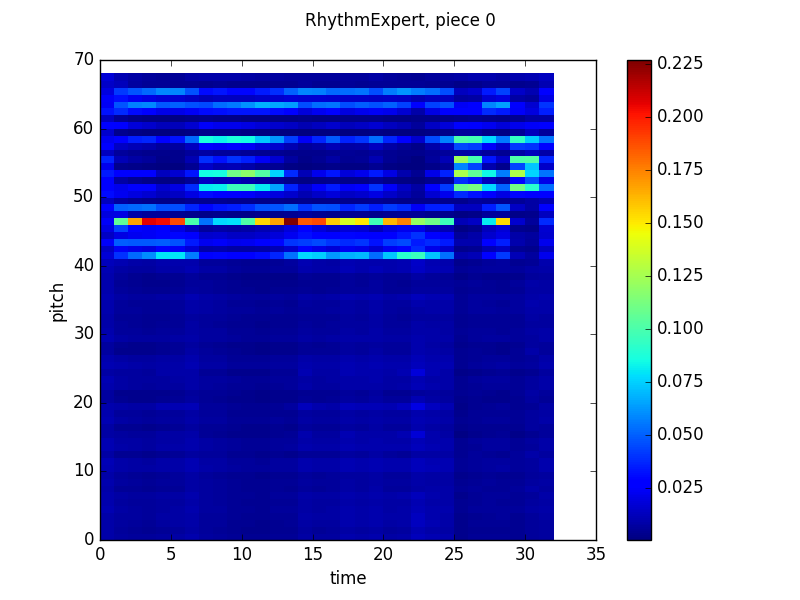
Now the middle output is really interesting from a musical perspective. If we take on faith that the pitch that the network outputs high probabilities for, pitch 46 (which just means it’s 46 half steps above the lowest note in the training set) is the tonic of the piece, then the other bright band (around 53) is a perfect fifth above, the dominant, the other bands fit with the other notes of the major scale! Further, the network is more likely to output the tonic in some places in the measure than others, which is again consistent with conventional wisdom. I’m not really sure what is happening in the last few beats of the piece, though. That is a quirk of this piece in the validation set and doesn’t appear elsewhere.
What Comes Next?
This was all work I completed by the first or second week of November this year, so I already know exactly what comes next! After finishing these models, I worked on creating a product model, which takes these four models (simple, spacing, contour and beat) and combines their output to get a more well-rounded model.
Two other posts I’ve been considering writing are a pure music theory background post on Bach and four part harmony and a post breaking down a similar paper that was recently released detailing a very similar project to this one. If time permits, I’ll write both of those posts before the end of the next month.